How to test floor prices and read the result honestly
A floor change always seems to work if you read eCPM, and always seems to fail if you read fill. How to test floor prices properly, what Google's own experiments give you, how long to wait, and a small script that says when a result is real.

On this page
- What we saw
- The metric: revenue per 1,000 requests
- Two ways to test
- The code
- Mistakes we see
- How VisionForgeX handles this
- Frequently asked questions
- How long should a floor price test run?
- What metric should I use to test floor prices?
- Can Google Ad Manager test pricing rules for me?
- Is a before and after comparison good enough?
- What if the result is "no clear difference"?
To test floor prices fairly, compare revenue per 1,000 ad requests between traffic with the new floor and traffic without it, over at least seven whole days, and call the result only when the difference is bigger than the normal day-to-day swing. Read eCPM alone and every floor looks like a win; read fill alone and every floor looks like a loss. Google Ad Manager has manual experiments for pricing rules that split traffic for you, and a before-and-after comparison works too if you are careful about what it can and cannot show.
This guide covers the metric, the length, the two ways to test and a script that turns daily numbers into a verdict. It follows how unified pricing rules work and floor prices by country and device.
What we saw
Our Floor advisor started by suggesting floors. Within a week of floors going live the harder question was what to do next, so on 8 Nov 2026 we built a page that answers it for each floor: raise it, lower it, remove it, keep it, or wait.
Writing the rules down forced us to be precise about three things.
Nothing is said before seven days. A floor that has run fewer than seven whole days in a row gets "wait", with a bar showing how many days have been measured and the date a verdict becomes possible.
The yardstick is the site's own swing. Revenue per 1,000 requests moves from day to day even when nothing changes. The page compares the change with the traffic's normal swing over the days before the floor, and treats anything inside that swing as no result at all.
A raise is at least 4%. When a floor works, the next step up is at least 4% higher. Smaller steps take weeks to measure and are lost in the swing.
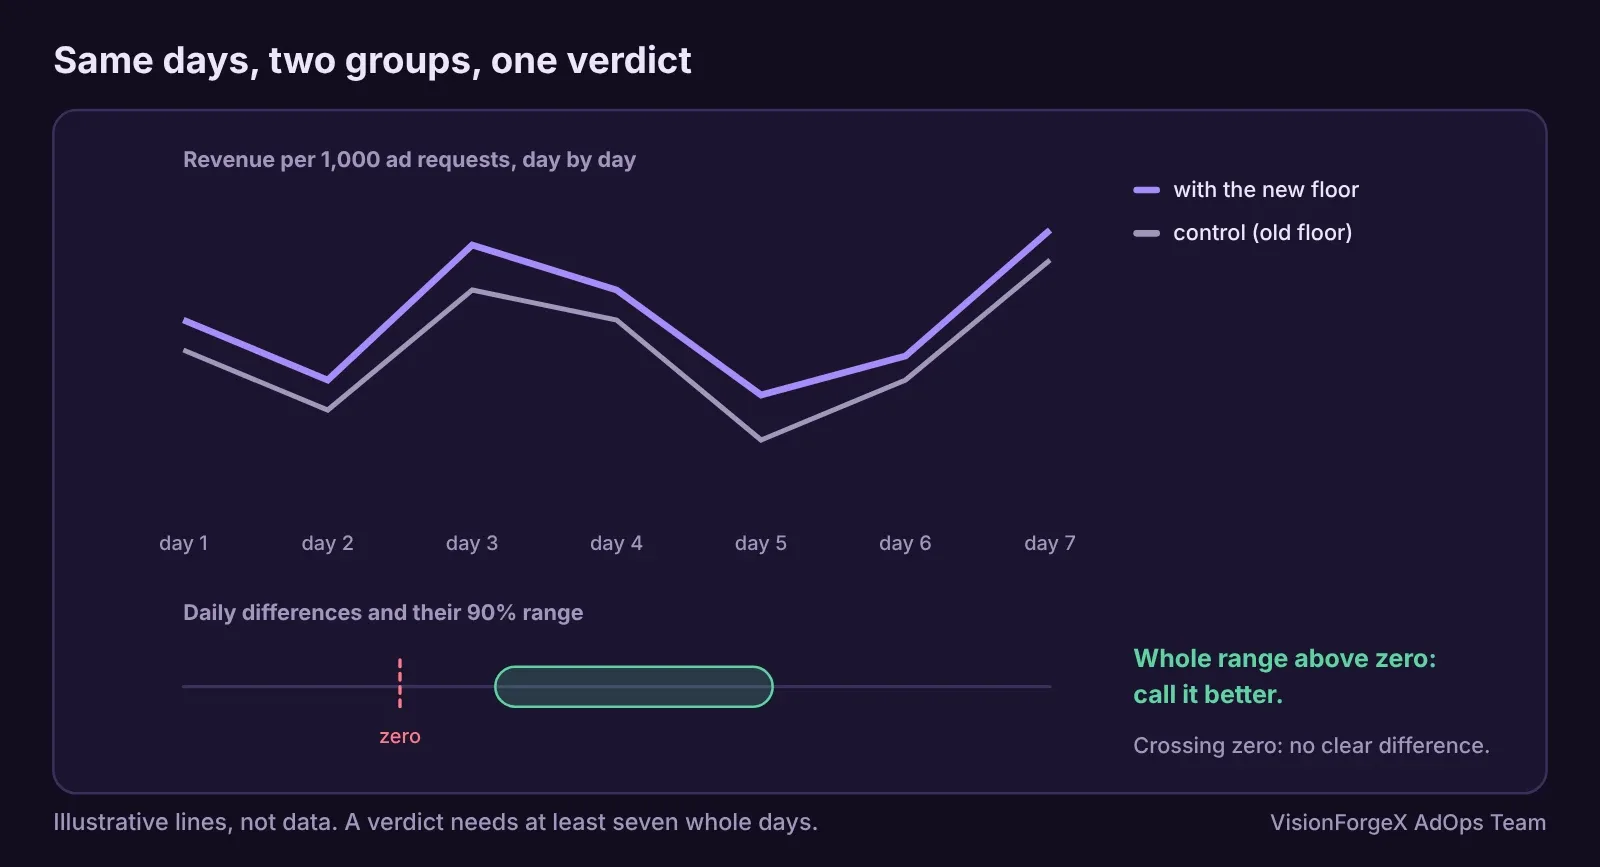
Separately, our Proof of Lift module measures features against a comparison group of visitors on the same days. Its rule for a verdict, which the script below follows, is: seven days, enough traffic in the comparison group (2,000 page loads), and a 90% range for the difference that does not cross zero.
The metric: revenue per 1,000 requests
A floor works by turning away bids that are too low. That always pushes eCPM up, because the cheap impressions are gone, and it always pushes fill down, for the same reason. Neither tells you whether the network earned more.
Revenue per 1,000 ad requests does. It is revenue divided by requests, times 1,000, and it falls when the empty slots cost more than the better prices add. Use requests, not impressions, as the bottom of the fraction. If your report has Ad Exchange revenue and ad requests for the inventory the floor covers, you have what you need.
One caution from Google's target CPM page: if the rule is a target CPM rather than a fixed floor, individual impressions sell below your number by design, so judge it by the same revenue per request, never by whether eCPM reached the target.
Two ways to test
A test with a control group. Some traffic gets the new floor and the rest keeps the old one, on the same days. Ad Manager's manual experiments do this for pricing rules: you choose the percentage of impressions that goes to the variation, each trial runs at least 7 days and at most 31, and you can set it to pause itself if revenue falls by more than you allow. Afterwards you decide whether to apply the variation. Google's page also reminds you to look at the whole network's revenue, not only the comparison.
Before and after. The floor goes live for everyone and you compare the weeks before and after. It is simpler and it works for small changes, but anything else that changed in those weeks (a holiday, a news spike, a new partner, a Google update) lands in your result. Compare whole weeks with whole weeks, so each weekday meets itself.
The code
This script takes daily numbers from a test with a control group, works out each day's difference in revenue per 1,000 requests, and gives a verdict only when the evidence is there. Export the daily rows from your report (or from the experiment page) into the shape below.
// days: [{ control: { revenue, requests }, test: { revenue, requests } }, ...] whole days, network time zone
function floorVerdict(days, opt = {}) {
  const minDays = opt.minDays || 7, minRequests = opt.minRequests || 0;
  const rpm = (g) => (g.requests > 0 ? (g.revenue / g.requests) * 1000 : null);
  const lifts = [];
  for (const d of days) {
    const c = rpm(d.control), t = rpm(d.test);
    if (c && t !== null && d.control.requests >= minRequests) lifts.push(t / c - 1);  // that day's relative difference
  }
  const n = lifts.length;
  if (n < minDays) return { verdict: 'wait', days: n };
  const mean = lifts.reduce((a, b) => a + b, 0) / n;
  const sd = Math.sqrt(lifts.reduce((a, b) => a + (b - mean) ** 2, 0) / (n - 1));
  const half = 1.645 * sd / Math.sqrt(n);             // a 90% range for the average daily difference
  const low = mean - half, high = mean + half;
  const verdict = low > 0 ? 'better' : high < 0 ? 'worse' : 'no clear difference';
  return { verdict, days: n, lift: mean, low, high };
}
// floorVerdict(rows) -> { verdict: 'better', days: 9, lift: 0.031, low: 0.012, high: 0.05 }  (an example of the shape)
How to read it: "better" means every value in the range is above zero, so the floor raised revenue per request on these days. "No clear difference" is a real answer: the floor did not do enough to show, and the cheap choice is usually to keep the old floor. "Wait" means fewer than seven usable days.
We ran the function in a headless browser against made-up series where we knew the answer: a steady 5% gain gives "better", a steady 5% loss gives "worse", noise around zero gives "no clear difference", and six days give "wait". We have not run it against a live Ad Manager experiment; the figures it reads are only as good as the export.
What it does not do: the range assumes days are roughly independent, which a big event can break; it does not replace looking at the days themselves. A before-and-after test has no control group, so this script does not apply to it as written; compare the after-week with the before-week's average and its own day-to-day swing instead, and be slower to believe it.
Mistakes we see
- Reading eCPM. It rises with every floor. Read revenue per 1,000 requests.
- Calling it on day two. Two days is noise, and today is incomplete because of the reporting delay.
- Changing two things at once. A new floor and a new refresh setting in the same week cannot be told apart.
- Big jumps. Doubling a floor makes a loss expensive. Step up by a few percent, and only after a clear "better".
- A test group that is too small. Ten percent of thin traffic gives a range so wide that nothing is ever clear. Give the test a larger share, or test on a busier site first.
- Forgetting to apply or remove. A finished experiment changes nothing until you apply it. An abandoned floor keeps turning bids away.
How VisionForgeX handles this
Our Floor advisor runs this judgement for every floor it suggested: after seven days in a row it says raise (by at least 4%), lower, remove (no gain after 14 days) or keep, with the exact price and the steps in Ad Manager, and it never changes your rules itself. For features other than floors, Proof of Lift keeps a comparison group on the same days. If you would like a second pair of eyes on a test you are running, write to us.
Frequently asked questions
How long should a floor price test run?
At least seven whole days in your network's time zone, so each weekday is included once. Google's manual experiments use the same minimum and run for up to 31 days.
What metric should I use to test floor prices?
Revenue per 1,000 ad requests for the inventory the floor covers. eCPM always rises with a floor and fill always falls, so neither alone tells you whether you earned more.
Can Google Ad Manager test pricing rules for me?
Yes. Manual experiments can change a pricing rule's floor for a share of traffic, compare it with the rest, pause themselves on a loss you set, and let you apply the result afterwards.
Is a before and after comparison good enough?
For small changes on steady traffic it can be, if you compare whole weeks. Anything else that changed in those weeks ends up in the result, so a control group on the same days is more reliable.
What if the result is "no clear difference"?
Then the floor did not change revenue per request by more than the daily noise. Keep the cheaper option, which is usually the lower floor, and test a different change.
 Yield and revenue optimization
Floor prices by country and device: two ways that fit in Ad Manager
One floor for the whole world is too high in some countries and too low in others. Two ways to set floors by country and device in Google Ad Manager, how we fit them under the 200-rule limit, and a mistake we made with page-wide targeting.
 Yield and revenue optimization
Unified pricing rules: how to set floors without losing fill
Pricing rules decide the lowest price an ad may sell for in your Ad Manager network. How Google applies them, why the floor is compared with your share and not the buyer's bid, which rule wins when two overlap, and the first floor we would set.
 Yield and revenue optimization
Ad refresh and Google's 30-second rule: what viewability changes
Google allows refreshing an ad no faster than every 30 seconds for time-based and event-based refresh, and wants you to declare it. Here is how it works, what we do in our own tag, and a timer that only refreshes ads people can see.